📅 Publish date: 16/10/2026
Decide A Framework Before You Test: A CRO Playbook
A lot of teams I work with run A/B tests, but they are often a one-off or minor changes. Very few of them run an experimentation programme. The difference has nothing to do with the testing tool, the traffic volume, or how clever the hypotheses are. It shows up in the twenty minutes after a result lands, when someone asks whether we’re really sure, someone else doesn’t like the variant, and the most senior person in the room has a feeling about it.
That’s the moment a programme either has authority or it doesn’t.
So instead of giving you a list of CRO tips, I’m going to walk one experiment through from start to finish, the way I run it. Where the idea comes from, what we’re actually testing, who decides, what the result is worth, and what happens to it afterwards. The framework lives in those steps.
Long before the experiment: find out how decisions get made
When a CRO programme starts, the instinct is to produce ideas. Resist it for half a day.
Get the people who own the journeys in a room and ask how experiments actually work here today. How ideas get sourced, prioritised and approved, including the informal route, which is usually “someone senior asked for it”. Which assumptions currently drive design, copy and journey decisions, and which of those has ever been validated. How results get evaluated, and on what basis a test gets called a winner. And the question that makes everyone uncomfortable: who can stop, ship or overrule an experiment, and on what grounds.
Then ask for three numbers from the last twelve months. How many experiments were started. How many were completed and analysed. How many winners were actually implemented in production. In a healthy programme those numbers sit close together. In a stalled one they look like this:
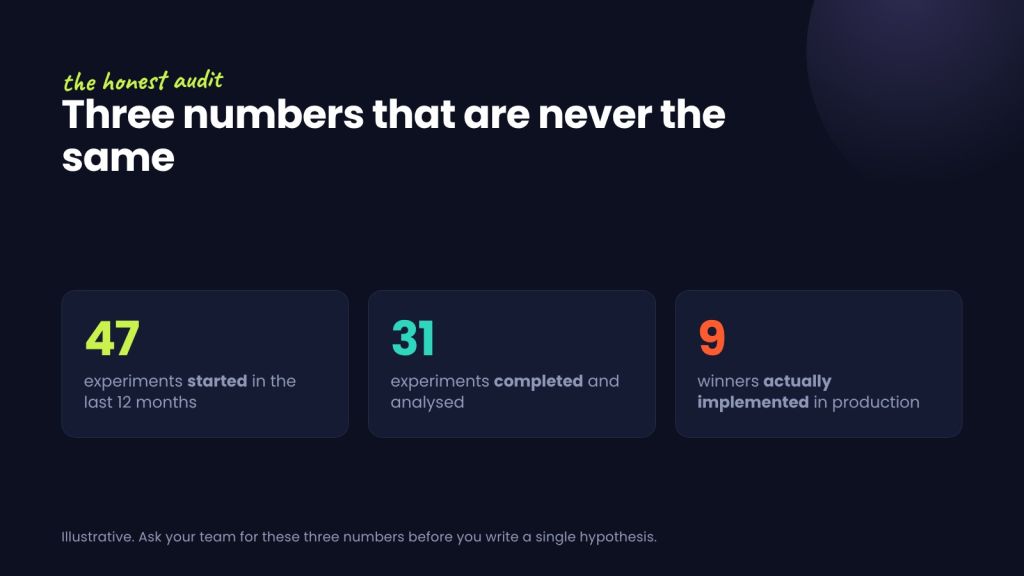
The gap between the first two numbers is a capacity problem: experiments started that never got finished, usually because something more urgent came along.
The last number needs a fourth one next to it before it means anything. Nine implemented out of thirty-one completed is roughly what a healthy win rate produces, and that’s fine. Nine implemented out of eighteen winners is an expensive leak. Same figure, opposite diagnosis. So ask how many winners there were, then ask how many of those are live in production today. That second ratio is the one that tells you whether results are allowed to change anything.
One more thing to check before you design anything: whether the foundation can carry it. Analytics implementation, event tracking, traffic and conversion volumes per journey, tooling, QA capacity, consent constraints. If the tracking on your conversion journey is unreliable, you’re not running experiments. You’re generating noise with a confidence interval around it.
Where the idea comes from
Now the experiment itself. It does not start with “what should we test on the product page?”
Here’s the pattern in most backlogs: twenty good ideas, each unrelated to the next. A button here, a form field there, a new hero image because the brand team wanted one. Tests win, tests lose, and after a year the organisation has learned that one button worked.
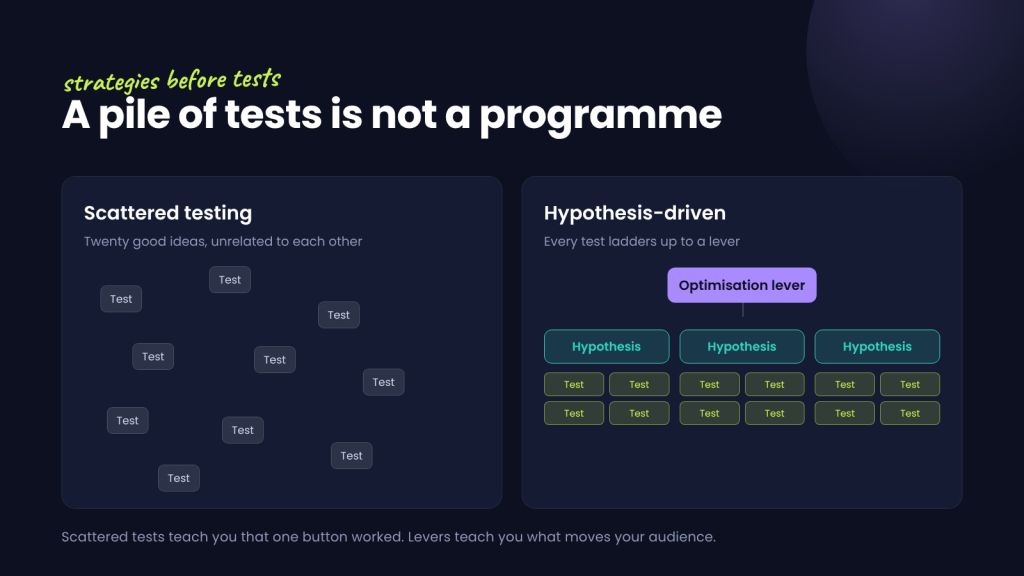
Every hypothesis I write gets filed under an optimisation lever first. I use five, and I call them CREST.
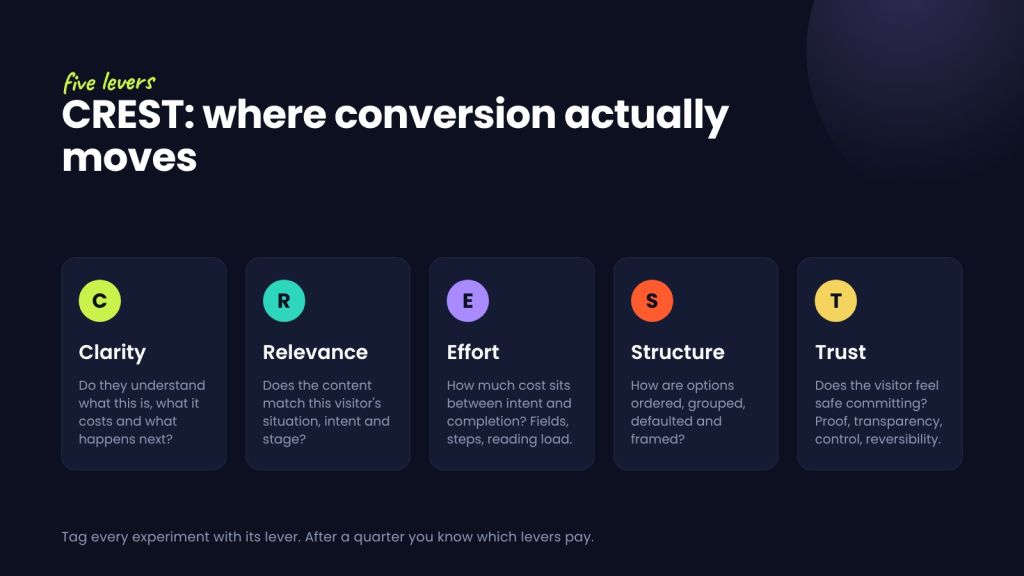
- Clarity. Does the visitor immediately understand what this is, what it costs and what happens next?
- Relevance. Does the content match this visitor’s situation, intent and stage? Someone comparing is not someone ready to buy.
- Effort. How much cognitive and interaction cost sits between intent and completion? Form length, required fields, number of steps, reading load, mobile behaviour.
- Structure. How are options, steps and information ordered, grouped, defaulted and framed? Which choice comes first, how many are offered, what the comparison looks like.
- Trust. Does the visitor feel safe committing? Proof, transparency on price and conditions, human contact, control, reversibility.
Tagging every experiment with its lever does something useful after a quarter. You can report not just which tests won, but which levers produce the highest win rate and the highest business value for your audience. That becomes the input for the next roadmap, and the knowledge compounds instead of scattering.
In one programme I ran for a B2C e-commerce brand in consumer mobility, Effort and Clarity carried most of the value, while Trust had one of the lowest win rates of the five. That surprised everyone, because it’s a considered purchase and trust feels like the obvious battleground. It wasn’t a universal truth. It was what that audience, in that market, in that year, responded to. You only find that out if you file your tests properly.
What you're actually testing
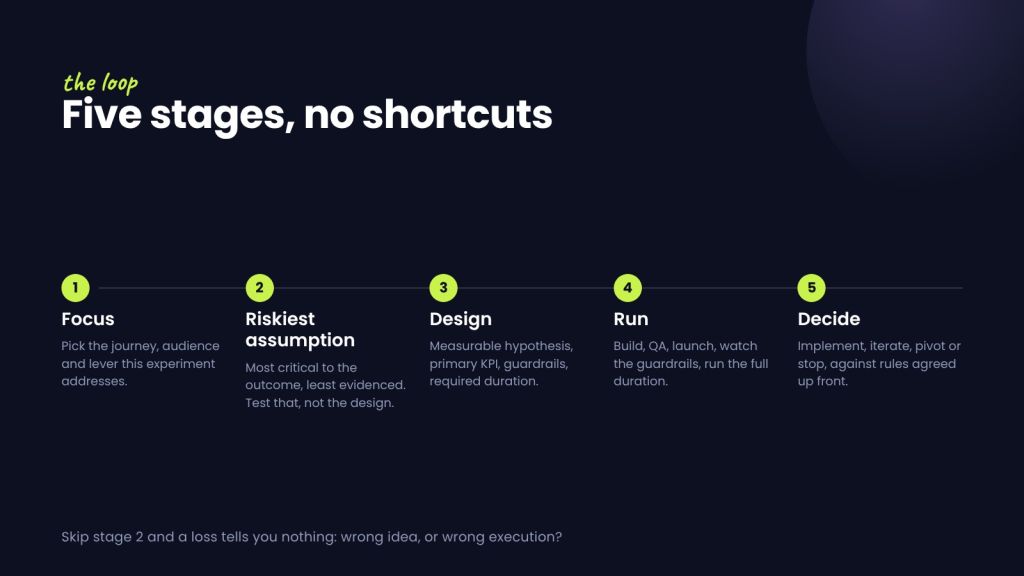
With a lever picked, the next question is the one that separates a programme from a pile of tests: what is the riskiest assumption here?
Not the most interesting assumption. The one that is both most critical to the outcome and least evidenced. That’s what the experiment tests. Not the design, not the copy, not the layout you happen to prefer.
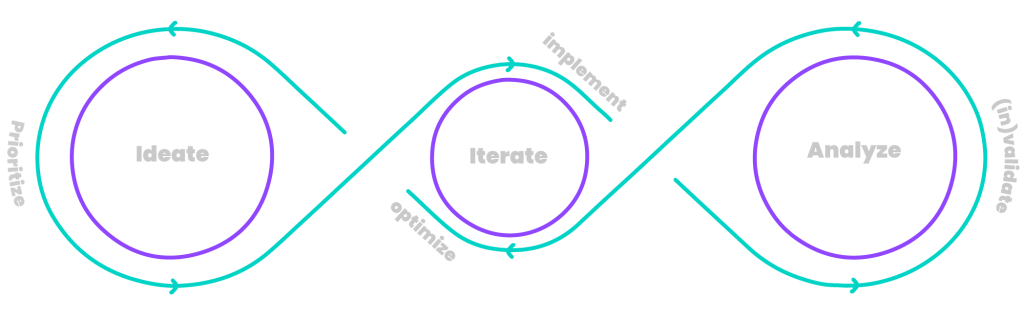
Skip that step and a loss tells you nothing. You won’t know whether the idea was wrong or the execution was, so the assumption survives and comes back in the next planning session wearing a different design. Test the assumption and a loss permanently removes a belief from your backlog. That has value too, it’s just harder to put on a slide.
From there the design work is mechanical: a measurable hypothesis in the form “if we do X, then Y% of visitors will behave in way Z”, a primary KPI, secondary KPIs, guardrail metrics, and a duration calculated up front rather than discovered halfway through.
The conversation to have before you launch
This is the part almost nobody writes down, and it’s the part that decides whether any of the rest matters.
Before the experiment goes live, agree in writing what each possible outcome means. I evaluate results on a Bayesian basis, because it answers the question the business is actually asking: how likely is it that this variant is better, and what does it cost me if I’m wrong? That’s a more useful conversation than a binary verdict on statistical significance.
For every experiment we report the probability to beat baseline, the credible interval around the uplift (so the realistic range of outcomes stays visible instead of collapsing into a yes or a no), the expected loss if we implement and we’re wrong, and the guardrail metrics confirming a win on the primary KPI didn’t damage something else.
Then the rules, fixed before anything launches:
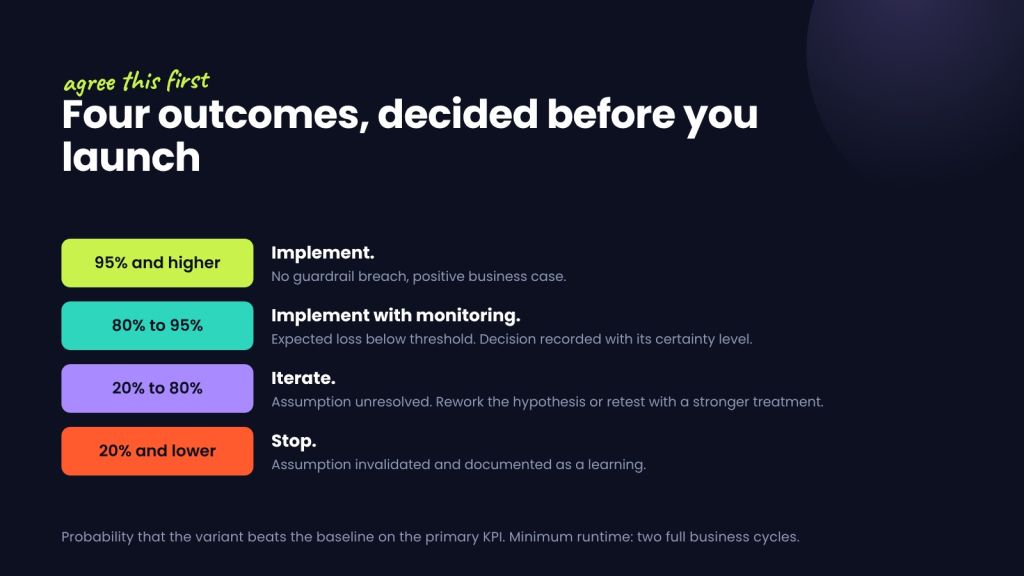
Two supporting rules matter as much as the thresholds. No experiment is called early on an interim result, unless a guardrail metric is breached. And the minimum runtime is two full business cycles, so fourteen days, to cover weekday, weekend and cycle effects, or the calculated sample requirement, whichever is longer.
This matters most on journeys with modest traffic, which is most B2B journeys and plenty of B2C ones. A strict significance threshold often leaves a test unreadable for months, and while everyone waits, the decision quietly defaults back to seniority. A probability read-out makes the state of the evidence explicit at any moment, so you can decide with a documented level of certainty instead of postponing.
That’s the whole trick. The rules get negotiated once, calmly, when there’s nothing at stake. After that, applying them is administration rather than politics.
Nobody argues with a result they don't like if they already signed off on the rule.
What the result is worth
The test runs, the numbers come back. “The variant lifted conversion by 11.8%” is a fact that goes nowhere. Translate it into money, using the organisation’s own lead value, order value or policy value, extrapolated over twelve months.
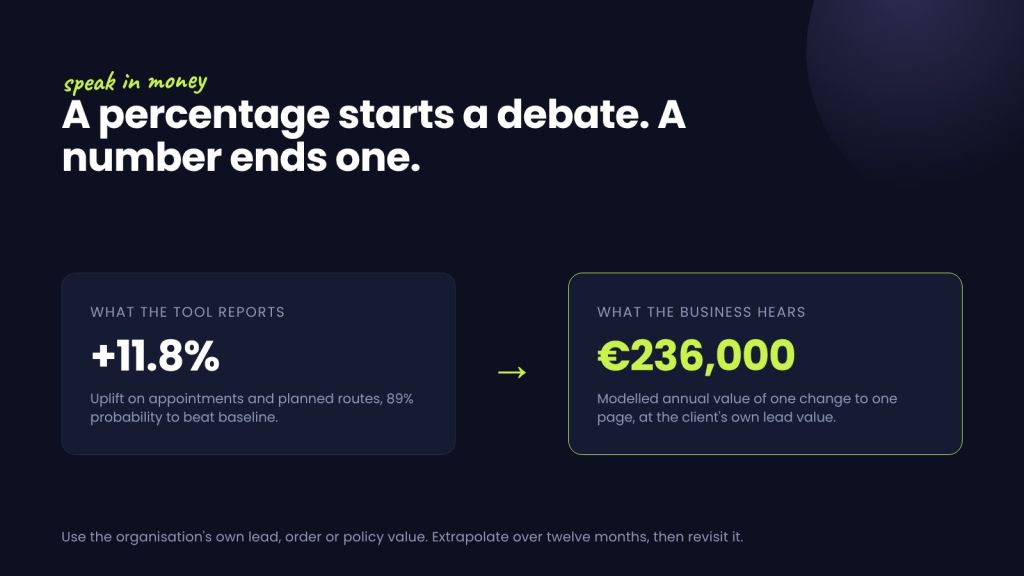
A real one from that same programme. We tested the store locator page, with the hypothesis that making the physical locations feel real would move people from browsing to booking. Appointments and planned routes went up 11.8% on desktop, at an 89% probability the variant beat the control. Converted at the client’s own lead value, that’s roughly 236,000 euros a year from one change to one page.
That number does two jobs. It makes the winner worth implementing properly instead of parking in a backlog, and it turns the next six months of testing budget into an obvious decision rather than a negotiation.
A caveat on cumulative figures, because I see them used badly. Across three years, that programme completed more than 80 experiments, with 28 winners and 21 clear losers, so a win rate around 30%, which is healthy. Add up the modelled business cases and you land somewhere in the region of 16 million euros. I’d treat a number like that as directional, not as a bank statement. Lead values move, markets move, and a model built on this year’s economics does not hold forever. Which is precisely why you keep testing instead of optimising once and declaring victory.
What happens to a winner
Here’s where most of the value quietly disappears. The team celebrates a 12% winner, the variant expires in the testing tool, the production code never changes, and six months later the business case lives only in a slide.
Every winner gets handed over with a written implementation specification, and someone tracks whether it actually reached production. If your implementation rate is below 90%, fix that before you run another test. It’s cheaper than any new experiment you could design.
Keeping that honest needs a rhythm people can actually hold:
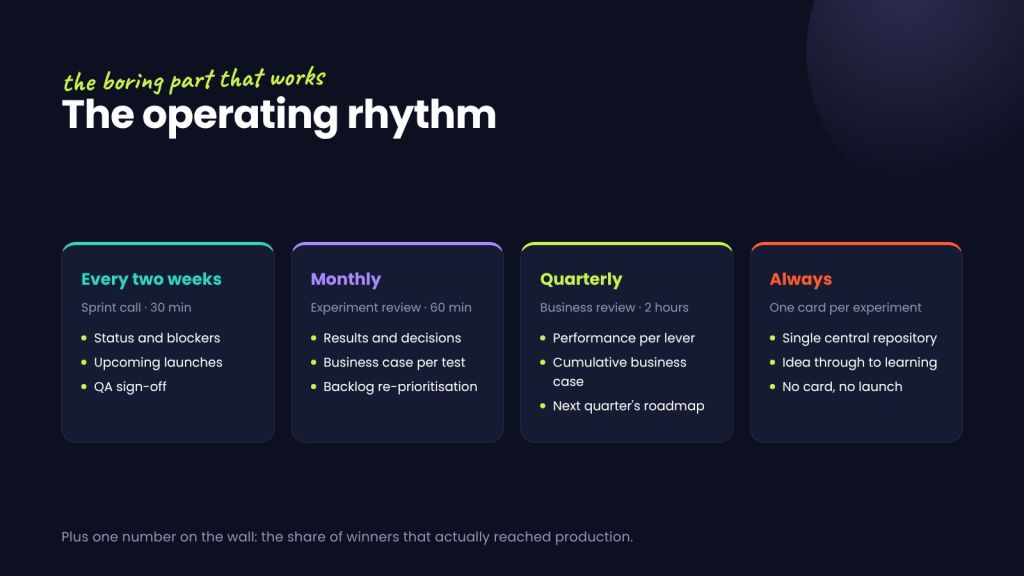
Thirty minutes every two weeks for status, blockers and QA sign-off. Sixty minutes monthly for results, decisions, business case and re-prioritisation. Two hours quarterly for performance per lever, the cumulative business case, start-stop-continue and the next roadmap. Fixed stages between research and learning, so nobody has to ask where something is.
And one rule that sounds bureaucratic until you’ve worked without it: no experiment goes live without a card in a single central repository. Airtable, Monday, Notion, whatever your team already opens every day.
What goes on the card
Steal this one. Every experiment in the repository carries the same fields, from idea to learning:
- The optimisation lever and the journey it sits on
- The riskiest assumption being tested
- The hypothesis, written as “if we do X, then Y% of visitors will behave in way Z”
- Primary KPI, secondary KPIs and guardrail metrics
- Audience, device and page
- Required duration, calculated before launch
- The result: probability to beat baseline, credible interval, expected loss
- The business case in euros
- The decision taken, and whether it has been implemented
- The learning, in one sentence someone outside the team can understand
When the assumption turns out to be wrong
Testing assumptions sounds like a confirmation exercise. In practice the valuable moments are the ones where you were wrong and something else moved the needle instead.
The clearest example from that programme was personalisation. We were cautious about it, and specifically cautious about localisation: showing people content tied to where they were. There’s a line where personalisation stops being helpful and starts being creepy, and we assumed localisation sat close to it.
It didn’t. The Dutch market turned out to be considerably more ready for it than we expected, and localised content shortened the distance between the online journey and the local distributor network, which is the part of the proposition that actually closes the sale. What we had filed as a risk became one of the stronger levers in the programme.
Two things made it work. It has to be helpful rather than showy: personalisation that makes the next step easier wins, personalisation that demonstrates how much you know about someone does not. And timing in the market matters. The same test three years earlier would plausibly have given the opposite answer. Readiness for personalisation moves, which is an argument for testing continuously rather than concluding permanently.
A losing test isn't a failed test
In a healthy programme, roughly two out of three experiments don’t win. That isn’t underperformance. That’s the actual rate at which confident assumptions turn out to be wrong, which is the entire argument for testing instead of guessing.
None of what’s above needs a bigger budget or a new tool. The audit is half a day. The decision rules are an hour of calendar time with the people who could overrule you. Re-filing your backlog under five levers takes an afternoon and immediately shows you which levers you have never tested. Start with the rules, because everything else is worth more once a result is allowed to decide something.
If the harder part for you is getting the organisation to care about testing at all, that’s a different problem and I wrote about it in adopting growth experimentation in marketing culture.
Running experiments and finding they produce more debate than decisions? That’s a governance problem, not a testing problem. Book a discovery call and I’ll walk you through how I’d set it up for your team.
Quick answers
How do I get stakeholders to accept a result they don’t like?
You don’t, not in that moment. You get their agreement on the rules before the test runs, when nobody knows which way it will go and nobody has anything to defend. Write down what happens at each outcome, who decides, and what counts as enough evidence. After that, applying the rule is administration. Trying to win the argument after the result is in is a losing game, because by then it’s their judgement against your number.
How much traffic do I need to run A/B tests?
Less than most people assume, if you change how you read results. A Bayesian evaluation gives you a probability and a realistic range of outcomes at any point, instead of a yes or no that only arrives at a fixed significance threshold. On low-traffic journeys, test closer to the top of the funnel, use a proxy metric nearer the change itself, and accept a documented level of certainty rather than postponing the decision indefinitely.
How long should an A/B test run?
Minimum two full business cycles, so fourteen days, to cover weekday and weekend behaviour, or the sample size you calculated up front, whichever is longer. Don’t call it early on an interim result unless a guardrail metric is breached. Early calls are where most false winners come from, and a false winner costs you more than a slow one.
What’s a good win rate for a CRO programme?
Somewhere around 25 to 35%. Much higher usually means you’re only testing safe changes or stopping tests the moment they look good. Much lower usually means hypotheses aren’t grounded in data or behavioural evidence. Track two things next to it: how many experiments resolved an assumption, win or lose, and how many winners actually reached production.
Who should own experimentation internally?
One named lead with a decision mandate, supported by a multidisciplinary team: data and insights, behavioural and UX design, front-end development, and someone owning planning and stakeholder alignment. Conversion problems are never only a design problem or only a data problem. And a lead without a mandate is a meeting organiser, which is the most common reason programmes stall.
Support
If you liked the article sharing it with your peers is really appreciated. Thank You!